Setting Up LibreOffice Calc for Four Key Use Cases
LibreOffice Calc is a versatile, free, and open-source spreadsheet tool ideal for tasks ranging from personal finance to advanced data analysis. Below, I outline four common use cases—personal budgeting, business sales tracking, academic grading, and data visualization—each with a step-by-step setup guide to configure Calc effectively. These setups use Calc’s core features (formulas, pivot tables, charts) and relevant extensions from extensions.libreoffice.org.
1. Personal Budgeting
Use Case: Track monthly income and expenses, categorize spending, and monitor savings goals.
Setup Steps
- Create a New Spreadsheet:
- Open LibreOffice Calc (download from libreoffice.org if needed).
- File > New > Spreadsheet.
- Set Up Columns:
- A1: “Date”, B1: “Category”, C1: “Description”, D1: “Income”, E1: “Expense”, F1: “Balance”.
- Format A1:A100 as Date (Format > Cells > Date > DD/MM/YYYY).
- Format D1:F100 as Currency (Format > Cells > Currency > $ or your currency).
- Enter Sample Data:
- A2:A5: Dates (e.g., 01/10/2025, 02/10/2025).
- B2:B5: Categories (e.g., Salary, Groceries, Rent).
- C2:C5: Descriptions (e.g., Monthly Pay, Supermarket).
- D2:D5: Income (e.g., 2000, 0, 0).
- E2:E5: Expenses (e.g., 0, 150, 800).
- Calculate Balance:
- In F2:
=D2-E2, then drag down to F3:F5 using the fill handle. - In F6:
=SUM(D2:D5)-SUM(E2:E5)for total balance.
- In F2:
- Add Conditional Formatting:
- Select E2:E100, go to Format > Conditional > Condition.
- Set “Cell value is > 500” and apply a red background to flag high expenses.
- Install Extension:
- Download Monthly Budget and Expense Record from extensions.libreoffice.org.
- Tools > Extension Manager > Add > Select .oxt file > Restart Calc.
- Use the template for pre-built budgeting categories and formulas.
- Save: File > Save As > budget.ods (OpenDocument Spreadsheet).
Pro Tip
- Use
SUMIFfor category totals:=SUMIF(B2:B100, "Groceries", E2:E100)to sum grocery expenses. - Add a Pie chart (Insert > Chart > Pie) to visualize spending by category.
2. Business Sales Tracking
Use Case: Monitor sales performance across products or regions, summarize data, and generate reports.
Setup Steps
- Create a New Spreadsheet:
- File > New > Spreadsheet.
- Set Up Columns:
- A1: “Date”, B1: “Product”, C1: “Region”, D1: “Units Sold”, E1: “Revenue”.
- Format A1:A1000 as Date, D1:D1000 as Number, E1:E1000 as Currency.
- Enter Sample Data:
- A2:A10: Dates (e.g., 01/10/2025).
- B2:B10: Products (e.g., Widget A, Widget B).
- C2:C10: Regions (e.g., North, South).
- D2:D10: Units (e.g., 100, 150).
- E2:E10: Revenue (e.g., 5000, 7500).
- Create a Pivot Table:
- Select A1:E1000, go to Data > Pivot Table > Create.
- Drag “Region” to Row Fields, “Product” to Column Fields, “Revenue” to Data Fields (Sum).
- Click OK to generate a table summarizing revenue by region and product.
- Add Formulas:
- In F2:
=D2*50(assuming $50/unit price) to calculate revenue if not provided. - In E11:
=SUM(E2:E10)for total revenue.
- In F2:
- Install Extension:
- Download DataPilotTools from extensions.libreoffice.org.
- Install via Tools > Extension Manager to enhance pivot table features (e.g., custom calculations).
- Save: File > Save As > sales.ods.
Pro Tip
- Use
VLOOKUPfor product details:=VLOOKUP(B2, G1:H100, 2, FALSE)to fetch prices from a separate table in G1:H100. - Create a Line chart (Insert > Chart > Line) to track revenue trends over time.
3. Academic Grading
Use Case: Calculate student grades, track performance, and identify pass/fail statuses.
Setup Steps
- Create a New Spreadsheet:
- File > New > Spreadsheet.
- Set Up Columns:
- A1: “Student ID”, B1: “Name”, C1: “Test 1”, D1: “Test 2”, E1: “Final Exam”, F1: “Average”, G1: “Grade”.
- Format C1:E100 as Number (0-100), F1:F100 as Percentage.
- Enter Sample Data:
- A2:A5: IDs (e.g., S001, S002).
- B2:B5: Names (e.g., Jane Doe, John Smith).
- C2:E5: Scores (e.g., 85, 90, 88).
- Calculate Average:
- In F2:
=AVERAGE(C2:E2), drag down to F5.
- In F2:
- Assign Grades:
- In G2:
=IFS(F2>=90, "A", F2>=80, "B", F2>=70, "C", F2>=60, "D", TRUE, "F"), drag down.
- In G2:
- Add Conditional Formatting:
- Select G2:G100, Format > Conditional > Condition.
- Set “Cell value is equal to F” and apply a red background for failing grades.
- Install Extension:
- Download Calendar for Calc from extensions.libreoffice.org for date-based tracking (e.g., exam dates).
- Install via Tools > Extension Manager.
- Save: File > Save As > grades.ods.
Pro Tip
- Use
AVERAGEIFto exclude zeros:=AVERAGEIF(C2:E2, "<>0")for students with missing tests. - Add a Bar chart (Insert > Chart > Bar) to compare student averages.
4. Data Visualization
Use Case: Create charts to visualize trends, proportions, or comparisons (e.g., sales, survey results).
Setup Steps
- Create a New Spreadsheet:
- File > New > Spreadsheet.
- Set Up Columns:
- A1: “Category” (e.g., Month, Product), B1: “Value” (e.g., Sales, Responses).
- Format B1:B100 as Number or Currency.
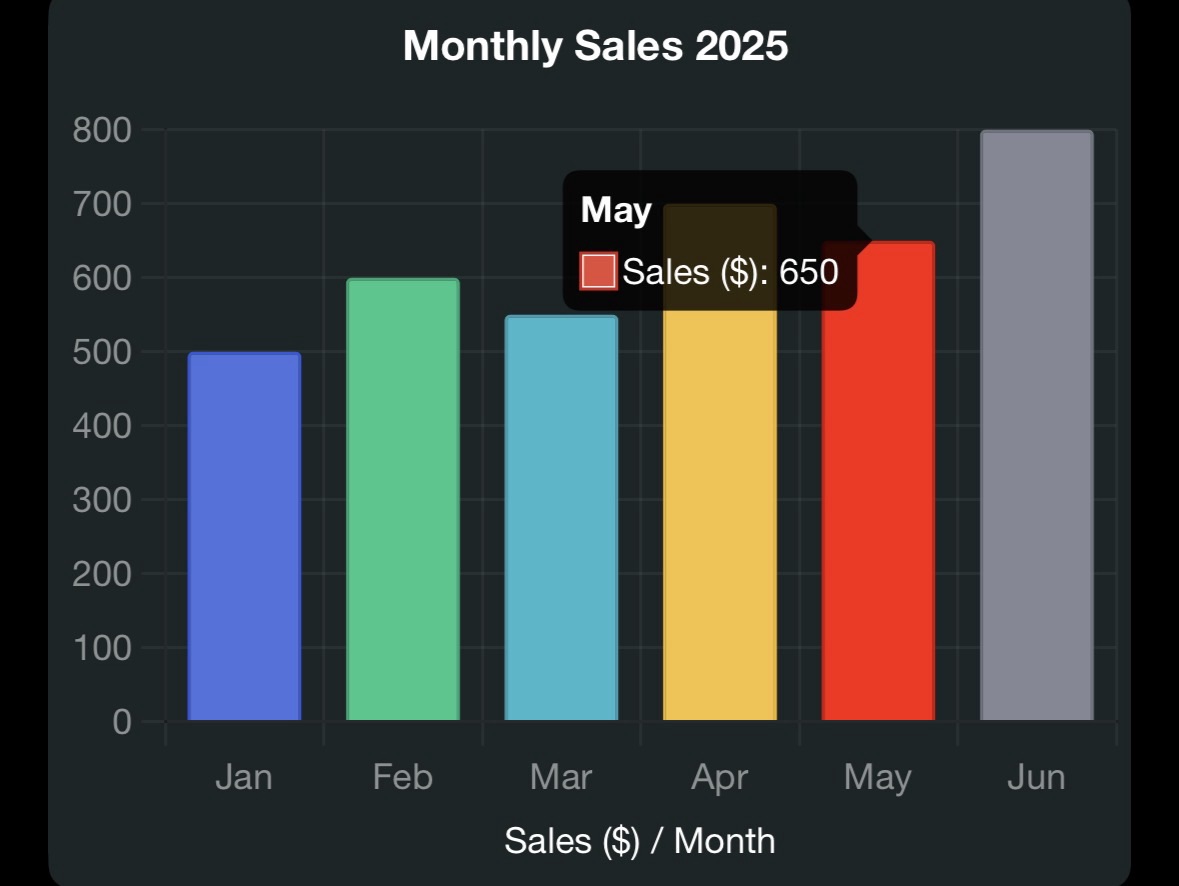
- Enter Sample Data:
- A2:A7: Months (Jan, Feb, …, Jun).
- B2:B7: Sales (500, 600, 550, 700, 650, 800).
- Insert a Chart:
- Select A1:B7, go to Insert > Chart.
- Choose chart type (e.g., Column for comparisons, Line for trends, Pie for proportions).
- In Chart Wizard:
- Data Range: Confirm
Sheet1.$A$1:$B$7. - Chart Elements: Add title (e.g., “2025 Sales”), X-axis label (“Month”), Y-axis label (“Sales”).
- Click Finish.
- Data Range: Confirm
- Customize Chart:
- Double-click chart to edit colors, gridlines, or scales.
- Right-click axis > Format Axis to adjust scale (e.g., start at 0).
- Install Extension:
- Download DataPilotTools for advanced charting with pivot tables.
- Install via Tools > Extension Manager.
- Save: File > Save As > charts.ods.
Pro Tip
- Use secondary Y-axis for dual metrics: Right-click chart > Insert/Delete Axes > Secondary Y-Axis.
- Export chart as PNG (File > Export) for presentations.
Example Chart (for reference, in Chart.js format, though Calc uses its own renderer):

Additional Tips for All Use Cases
- System Requirements: Calc runs on Windows 7+, macOS 10.15+, Linux; 512MB RAM (2GB recommended); 1.5GB disk space.
- Extensions: Install via Tools > Extension Manager > Add (.oxt files). Enable Java if needed (Tools > Options > Advanced).
- Macros: Record macros (Tools > Macros > Record Macro) for repetitive tasks, enhanced by LibreMacro extension.
- File Formats: Save as .ods for full features; export to .xlsx or .csv for compatibility.
- Performance: Disable AutoCalculate (Tools > Cell Contents > AutoCalculate) for large datasets.
- Resources: Consult LibreOffice Help or Ask.LibreOffice forums.
Clarification on Your Query
Your query “Calc sulp by uses” likely intended “setup by uses,” building on your previous Calc-related questions (e.g., extensions, charts). I interpreted “sulp” as a typo for “setup” and “uses” as practical applications, focusing on four key setups. The earlier “fuor 122” was unclear, possibly a typo for “four,” and I assumed no specific connection to “122.” If you meant something else by “sulp” (e.g., a function, feature, or term) or want a different focus (e.g., specific Calc tools, data types, or Vivo V50 Lite context), please clarify. For example:
- If “sulp” refers to a specific Calc feature (e.g., sum, solver), name it.
- If “122” relates to a dataset, version, or chart, provide details.
- If you meant a different software or context, specify it.
For more extensions, visit extensions.libreoffice.org. Start setting up your Calc spreadsheets and share your favorite use cases!
Summary: The guide covers setting up Calc for budgeting (with SUM, conditional formatting), sales tracking (pivot tables, VLOOKUP), grading (IF, AVERAGE), and visualization (charts), with relevant extensions and tips.